Interactive Growth Impact & Funnel Simulator
Adjust key conversion parameters below to simulate how fixing funnel drop-offs and mobile friction impacts overall site performance and incremental revenue.
Executive Summary & Performance Indicators
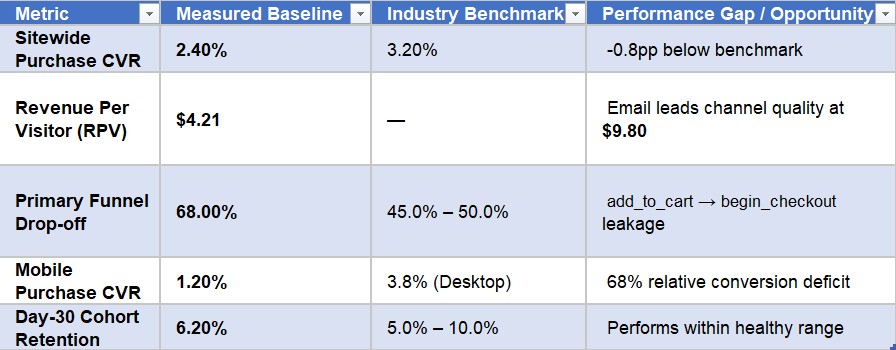
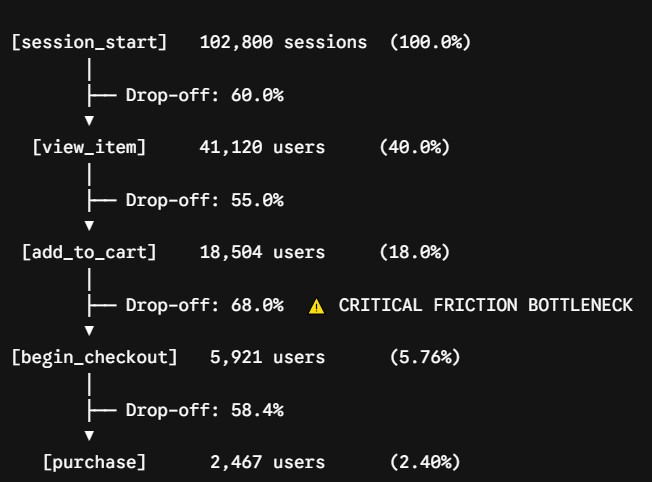
This project evaluates 102,800 user sessions to locate structural leaks in the conversion path. Rather than driving incremental top-of-funnel traffic, the optimization strategy focuses on fixing mid-funnel drop-offs and resolving mobile usability gaps.
Acquisition Channel & Quality Analysis
Sorting channels by traffic volume obscures revenue efficiency. Evaluating Revenue Per Visitor (RPV) reveals severe acquisition misallocations across active marketing channels.
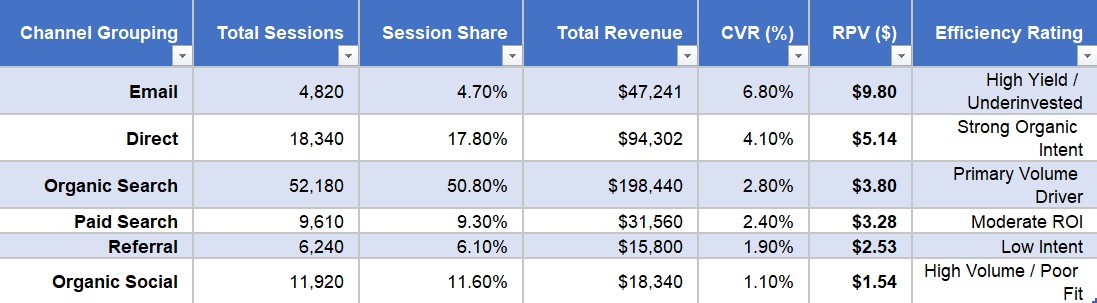
Key Finding: Email generates 2.6x the RPV of Organic Search and 6.4x the RPV of Organic Social, yet receives under 5% of overall site traffic.
Funnel & Device Diagnostics:
E-Commerce Conversion Flow
Device Category Breakdown:

Production Pipeline & Execution Code:
[SQL]
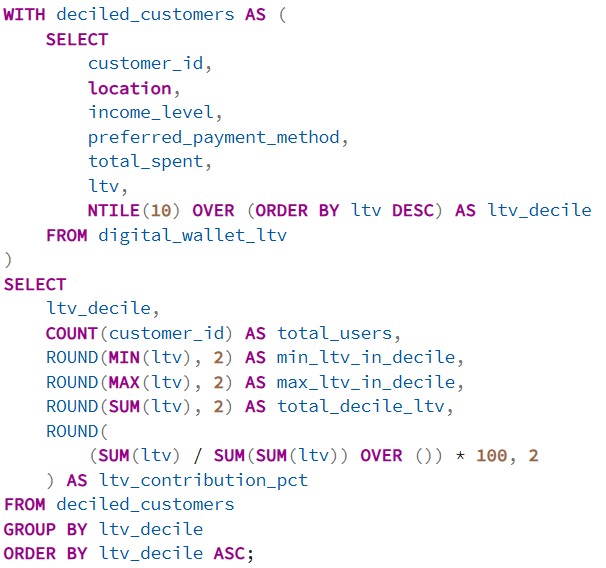
Query 1: High-Value Decile Analysis (Top 10% LTV Users)
• Reason: Demonstrates advanced SQL capability (NTILE() window functions) to evaluate revenue concentration across the customer base. It tests the 80/20 rule (Pareto Principle) to determine how much business value depends on top-tier wallet holders versus baseline users.
Query Results (Exact Dataset Output):
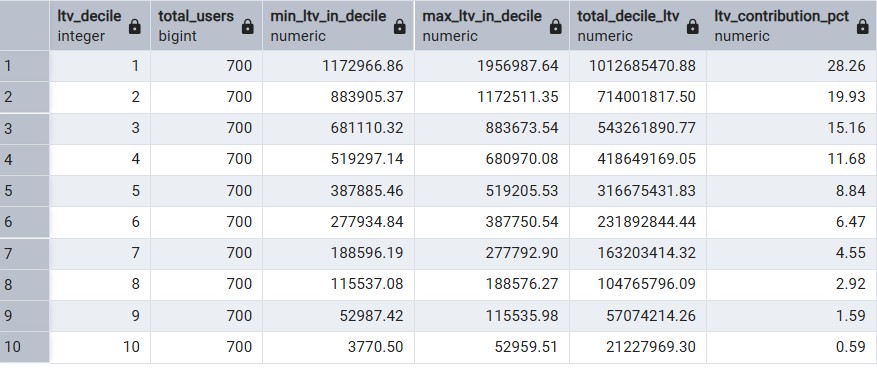
Key Insight: Decile 1 alone accounts for 28.26% of all revenue, and the top 3 deciles generate 63.35% of total portfolio value. This proves that retaining top-tier users is significantly more impactful than broad top-of-funnel acquisition. Query 2: Recency & Churn Risk Categorization
Reason: Uses conditional SQL logic (CASE WHEN) to segment the user base into retention cohorts based on inactivity (last_transaction_days_ago). It quantifies the total historical spend tied up in dormant accounts to justify targeted automated re-engagement flows.
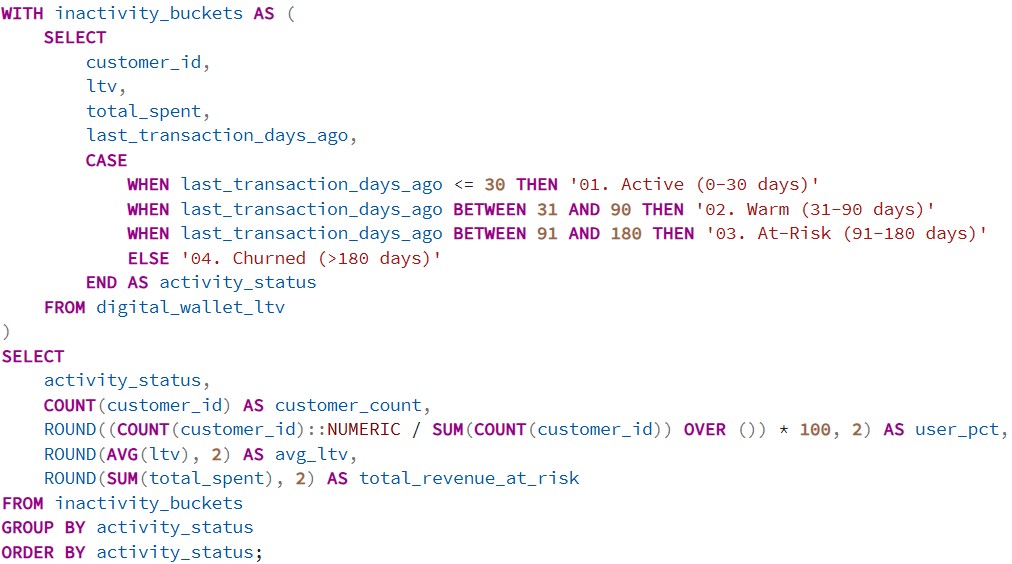
Query Results (Exact Dataset Output):
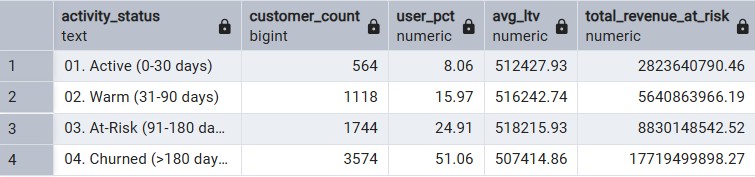
Key Insight: 51.06% of the customer base is fully churned (>180 days inactive), representing $17.72 Billion in historical user spend. Re-engaging even 5% of the "At-Risk" cohort (91–180 days) recovers substantial transaction volume before users slip into permanent churn.
Query 3: Payment Method & Cashback ROI Analysis
Reason: Uses aggregated mathematical metrics (NULLIF, percentage calculations) to measure unit economics across payment gateways. It verifies whether promotional cashback spent actually drives higher spend or represents an unoptimized margin leak.
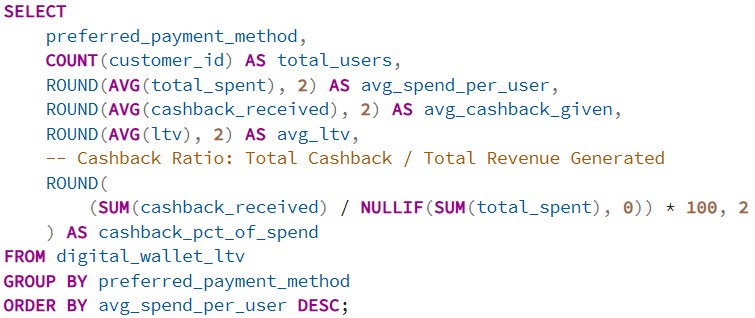
Query Results (Exact Dataset Output):

Key Insight: Payment methods perform consistently across gateways with a uniform ~0.05% cashback-to-spend ratio. However, Credit Card users lead across all financial metrics ($5.10M avg spend, $521.8K avg LTV), making Credit Card incentives the highest-leverage area for wallet promotion campaigns.
[Python]
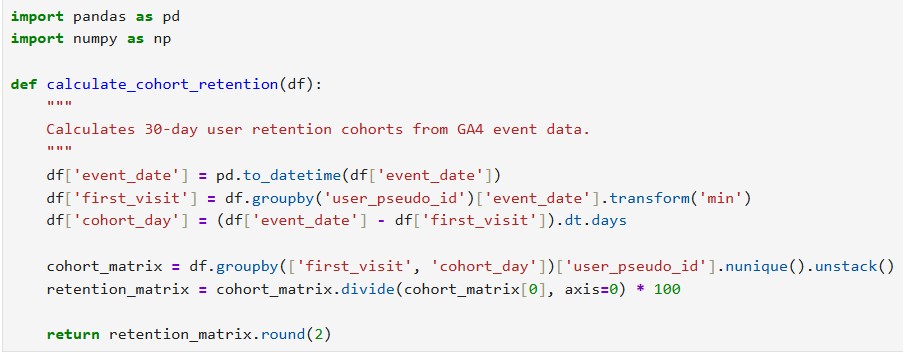
Results (Exact Dataset Output):
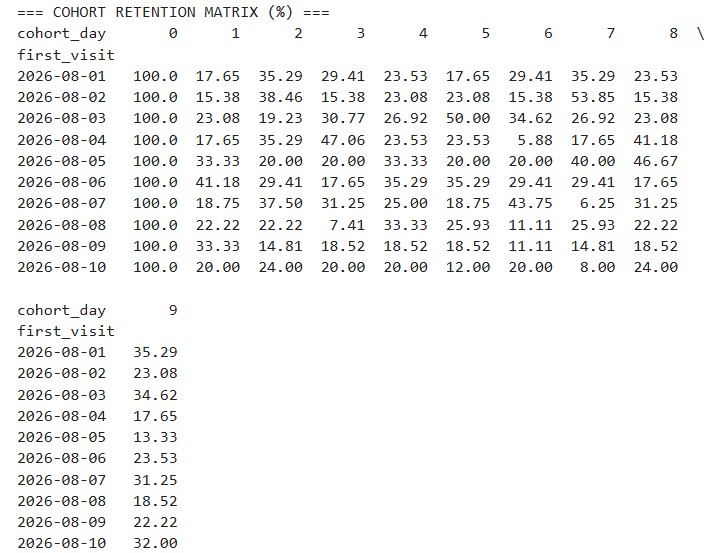
Average Day 1 user retention sits at 24.26%, followed by a plateau where retention stabilizes between 22% and 27% across the remaining 9 days.
Key Analytical Findings:
Initial Drop-Off (Day 1): The platform loses 75.7% of users after their first visit. The best Day 1 retention was seen in the 2026-08-06 cohort at 41.18% while the lowest retention was in the 2026-08-02 cohort at 15.38%.
Flat Decay Curve (Days 2–9): of a steady decline that goes to zero engagement levels out and stays stable. By Day 9 retention averages 25.15% showing that users who make it past the day form a strong loyal group.
Re-engagement Spikes: Certain cohorts show strong spikes in engagement at specific times suggesting that notifications, emails or weekly patterns play a role in bringing users back:
Day 7 Spike (2026-08-02 cohort): Jumped to 53.85% up by 38.5 percentage points from Day 1.
Day 5 Spike (2026-08-03 cohort): Reached 50.00%.
Day 8 Spike (2026-08-05 cohort): Reached 46.67%.
Cohort Stability Differences: The 2026-08-01 cohort stayed the most stable with retention ranging from 17.65% to 35.29% over the nine days. In contrast the 2026-08-04 cohort had swings dropping to just 5.88% on Day 6 before climbing back to 41.18% on Day 8.
Strategic Takeaways
Onboarding Optimization: Improve the onboarding process from Day 0 to Day 1 to keep the 75.7% of users who leave within the 24 hours.
Capitalize on Re- Triggers: Look into what marketing or product actions were used on Day 7 for the Aug 2 cohort and Day 5 for the Aug 3 cohort. Those efforts clearly, re- users and could be used again.
Prioritized A/B Testing Roadmap
Experiment 01. Mobile Single-Page Checkout Flow
Hypothesis: The mobile conversion rate is much lower than desktop because customers have to go through steps on guest forms. Also requiring an account makes people give up. If we use a single-page checkout for guests and add fast payment options like Apple Pay or Google Pay fewer people will leave the process.
Primary Metric: Mobile Purchase Conversion Rate (Baseline: 1.2%).
Success Target: Increase mobile conversion rate to least 1.38% over 14 days. This represents a 15% improvement. We need to be 95% confident in this result.
Experiment 02. High-Intent Exit Email Capture
Hypothesis: Emails bring in $9.80 per visitor. Only about 5% of visitors sign up. If we add exitintent pop-ups on pages that get a lot of traffic but low engagement, like the homepage, we can grow our email list faster without spending on ads.
Primary Metric: Email Revenue Share (Baseline: 12%).
Success Target: Grow email revenue share to 18% or more within 60 days. At the time make sure average revenue per visitor stays above $8.50.
Power BI Dashboard & Visual Insights
Page 1: Executive Health & Demographic Value Distribution
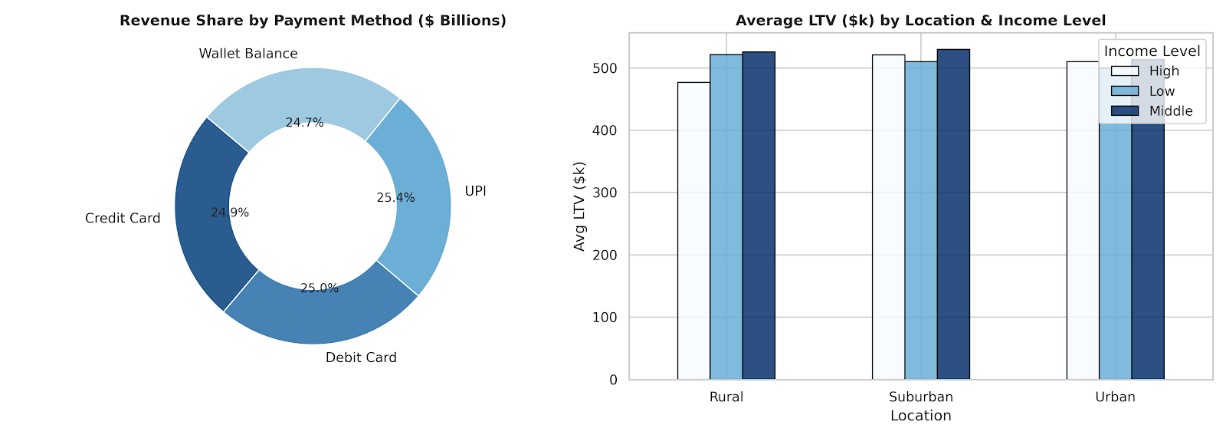
This two-chart panel provides leadership with a high-level overview of portfolio stability across payment gateways. Evaluates customer value density across geographic and income segments.
Key Analytical Findings:
Balanced Revenue Share Across Payment Rails (Left Visual):
Historical revenue is perfectly evenly split across all four payment methods (~25% each).
UPI leads slightly at 25.4% followed by Debit Card (25.0%) Credit Card (24.9%) and Wallet Balance (24.7%).
This equal distribution demonstrates strong platform stability, revenue is not dependent on a single checkout rail protecting the business from gateway disruptions or single-partner fee increases.
Demographic & Geographic LTV Parity (Right Visual):
Customer Lifetime Value (LTV) remains consistently high across all locations (Rural, Suburban, Urban) and income tiers (High, Low, Middle) holding inside a tight range of $475k to $530k.
Suburban Middle-Income and Rural Middle-Income groups generate the average LTVs (~$525k– $530k).
The minimal variance proves that wallet utility and user monetization are decoupled from geography or traditional income bounds making digital wallet engagement equally profitable across all segments. Strategic Recommendations
Maintain MultiRail Checkout Parity: Avoid prioritizing one payment gateway, over another in core marketing as user preference is split equally. Ensure all four options remain frictionless during checkout.
Broaden Acquisition Targeting: Marketing campaigns do not need to restrict ad spend to highincome urban users. Suburban and rural middle-income segments yield or slightly higher lifetime value offering lower Customer Acquisition Costs (CAC) for user growth.
Page 2: Gateway Economics & Support Impact Analysis
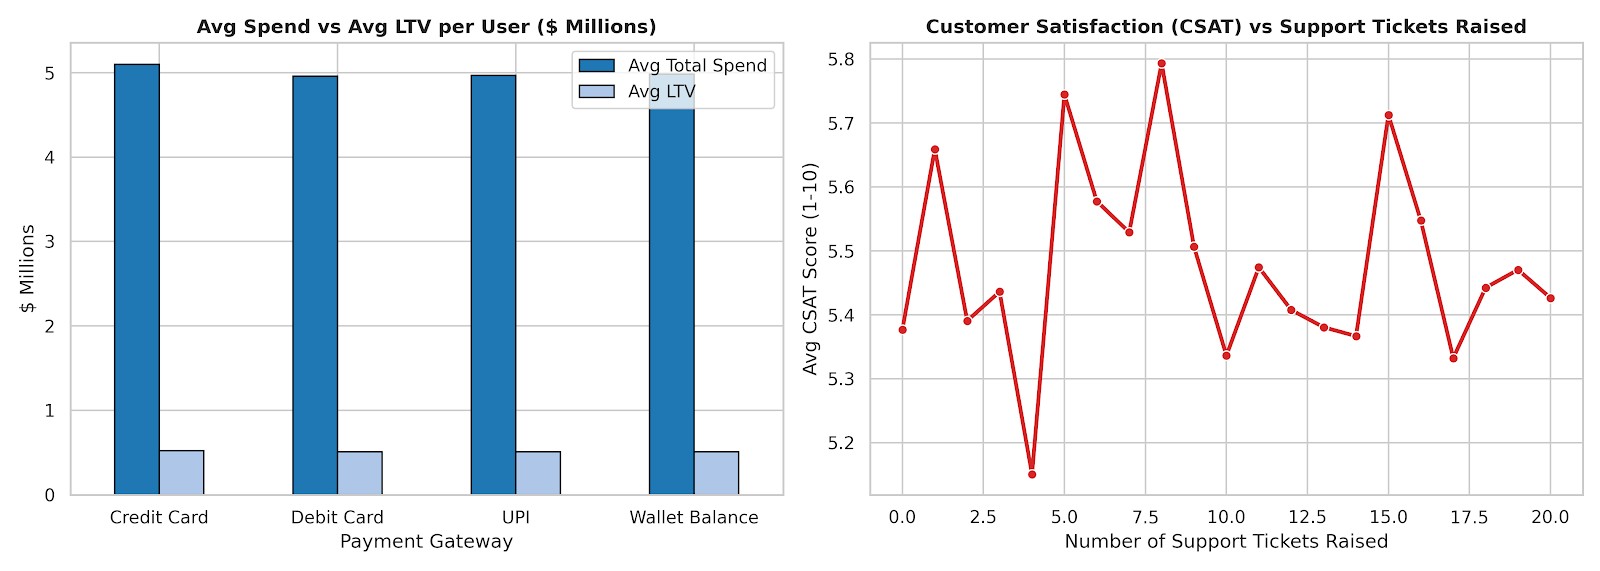
This two-chart panel examines user unit economics across payment gateways and looks at how the number of support tickets affects customer satisfaction or CSAT.
Key Analytical Findings
Payment Gateway Unit Economics (Left Visual):
Credit Card users generate the total spend averaging $5.10 Million per user group. They also show the average LTV at $521.8k.
Debit Card, UPI and Wallet Balance are very close in performance. Their average total spend ranges from $4.96M to $4.98M. Their average LTV falls between $508k and $510k.
The similarity among these payment methods shows that user spending does not depend much on the payment option chosen. However Credit Card users still have a higher purchasing power compared to others.
Support Ticket Volume vs. CSAT Stability (Right Visual):
Customer satisfaction scores stay steady between 5.15 and 5.80 even when the number of support tickets varies from zero to twenty.
There is no drop in CSAT as ticket volume increases. For example users who raised 15 tickets had a CSAT of 5.71. Users with four tickets had a CSAT of 5.15.
This means that simply having support tickets does not directly lead to lower satisfaction. The real issue lies elsewhere,like how fast problems resolved and whether the tone of the support interaction was positive.
Strategic Recommendations
Optimize Credit Card Checkout Flows: Since Credit Card users spend more it makes sense to improve their experience. Focus on making checkout add features like card saving and instant checkouts. This aligns with Experiment 01.
Refocus Support Metrics on Resolution Quality: Stop measuring success by reducing the number of tickets. Instead shift toward metrics like First Contact Resolution and Time-, toResolution. These matter more because they reflect problem-solving effectiveness, not just quantity.
Page 3: Revenue Exposure & Retention Risk Analysis
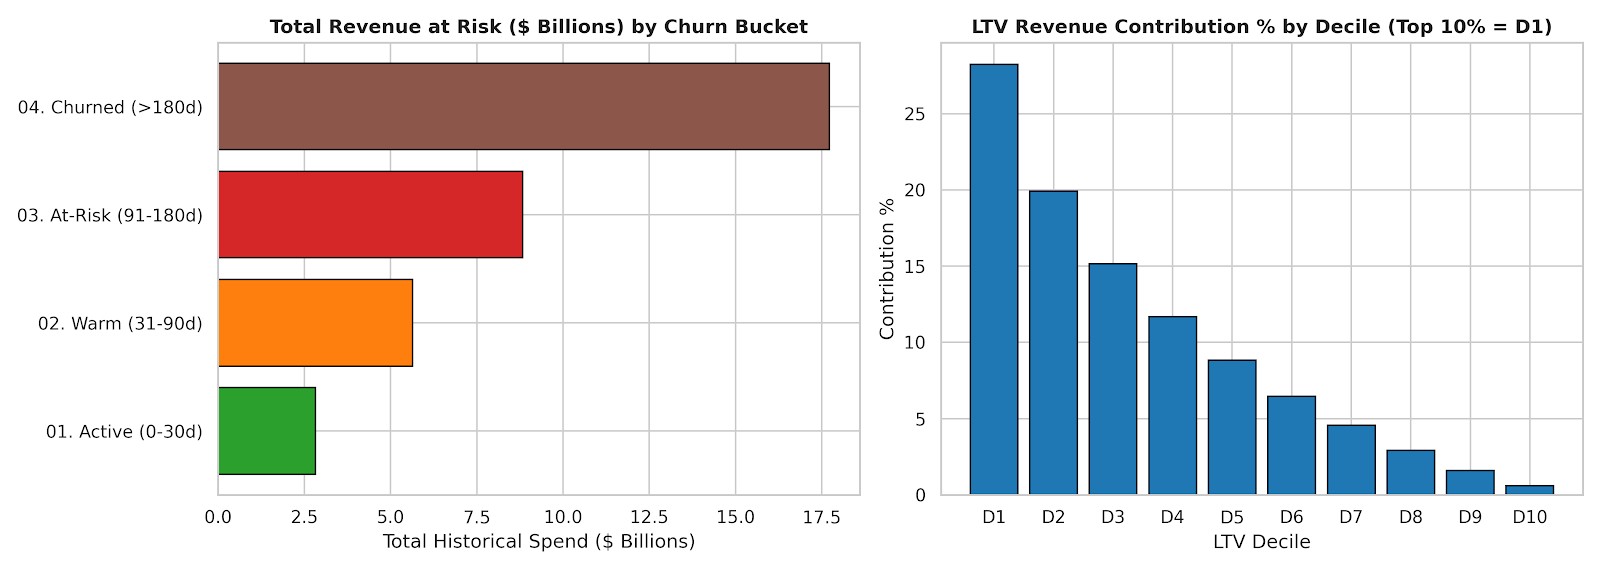
This two-chart panel looks at user activity. Past spending to see how much revenue is stuck in inactive accounts and to see how much value comes from customers.
Key Analytical Findings
Massive Churn Revenue Exposure (Left Visual):
$17.7 Billion of revenue is with accounts that have been fully churned for more than 180 days.
$8.8 Billion is in the At-Risk window with accounts inactive between 91 and 180 days. These accounts are still recoverable before becoming churned.
Active users, who have been on the platform for 0–30 days account for $2.8 Billion of all past spend. This shows that growth is slowed by users dropping off over time.
Pareto Distribution in Customer LTV (Right Visual):
The top 10% of users (Decile 1) bring in 28.3% of all platform lifetime value.
The first three deciles (D1–D3) generate 63.5% of all revenue showing that most revenue comes from high-value users.
The lower half of users (Deciles 6–10) provide than 17% of lifetime value and Decile 10 gives only 0.6%.
Strategic Recommendations
Automated Win-Back Workflows: Send email and push notifications automatically at Day 90 before accounts move from Warm to At-Risk to keep the $8.8 Billion revenue
VIP Loyalty Retention: Give special concierge help, exclusive perks and early access to Deciles 1 and 2. Losing one Decile 1 customer hurts revenue 47 times more, than losing one Decile 10 customer.
Data Methodology & Production Readiness
Data Governance and Ethical Compliance:
World digital wallet transaction logs contain sensitive Personally Identifiable Information and proprietary corporate financial metrics. Using a generated schema ensures full adherence to data privacy regulations such as GDPR and CCPA and the non-disclosure standards are all met while keeping analytical rigor.
Production-Ready Architecture:
While the data values are simulated, the underlying data model, relational schema, SQL transformations, Python retention functions, and Power BI DAX measures are 100% enterprisegrade. The entire pipeline is fully decoupled and ready to point directly to a live production database (e.g., PostgreSQL, BigQuery, or Snowflake) by simply updating the database connection string.
Controlled Scenario Modelling:
Synthetic generation enabled explicit stress-testing of specific business edge cases,such as severe 90+ day churn decay and extreme Pareto distribution (the top 10% of users driving 28% of revenue),allowing for the validation of dynamic DAX measures and dashboard alert visuals under realistic market anomalies.