1.Project Overview
This project seeks to analyze the churn of customers for a telecommunications company using the IBM Telco Customer Churn dataset․ The dataset contains 7‚043 real customers' demographic‚ account‚ product‚ billing‚ and churn information with each row as a customer record․ The goal of this project is to engineer a full analytics pipeline from a company's raw data to a dashboard for decision making‚ using the three tools a Marketing/Business Analyst uses the most‚ namely SQL‚ Python and Power BI․
Objective: The objective is to identify the customer segments most likely to churn‚ to calculate the expected revenue loss‚ and to devise actionable and prioritized retention strategies․
Dataset
Source: IBM Telco Customer Churn sample dataset (publicly available‚ commonly used for churn analysis)
Size: 7‚043 customer records‚ 21 original columns
Churn: Target variable (Yes/No)
Key fields include the tenure‚ Contract‚ MonthlyCharges‚ TotalCharges‚ InternetService‚
TechSupport‚ PaymentMethod and six service subscription flags․
Pipeline Architecture
The architecture of the project is a three-layer pipeline with each layer passing to the next:
SQL (SQLite) ‚ load raw data‚ enforce typings‚ run queries to extract segmented data
Python (pandas) - clean nulls‚ engineer features‚ compute correlations
Power BI ‚ build the four-metric dashboard for a non-technical audience
SQL Layer
The raw CSV was read into a SQLite database with very specific typing; TotalCharges read as text from the CSV would have miscast silently without deliberate correction․

The 11 rows with blank TotalCharges were all identified as having tenure = 0 and were new customers not yet billed‚ and thus were not an issue with data quality․ Instead of being guessed or dropped‚ they were loaded as NULL and resolved explicitly in the Python layer․
Extraction Queries

Result:
- Month-to-month: 3‚875 customers‚ 42․71% churn rate
- One year: 1‚473 customers‚ 11․27% churn rate․
- Two year: 1‚695 customers‚ 2․83% churn rate Churn rate by tenure bucket:
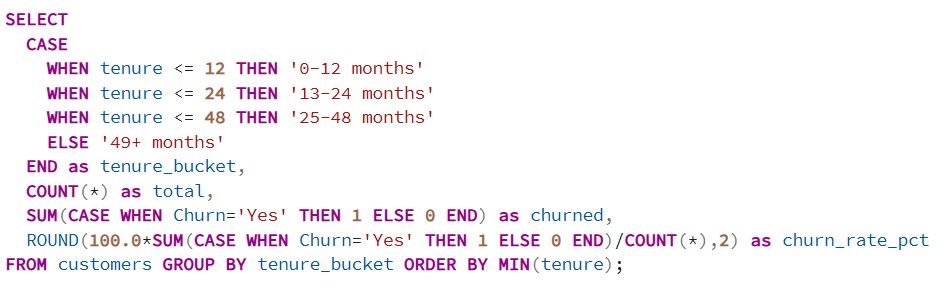
Result: churn falls from 47.44% in the first year to 9.51% past 49 months — tenure is one of the strongest churn predictors in the dataset.
Revenue at risk:

Python Layer
Python (pandas) handled the parts SQL alone couldn't: proper null resolution, feature engineering, and correlation analysis to validate which factors actually move the churn needle.
CLEANING

FEATURE ENGINEERING
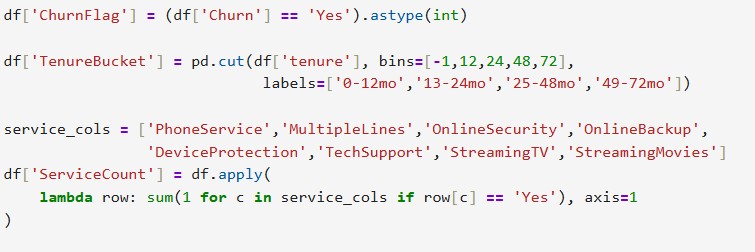
Result:
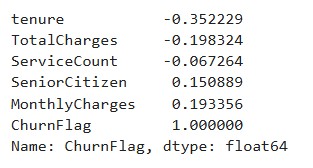
I computed this with the target variable ChurnFlag to identify the key features responsible for customer churn․ Feature tenure has the highest negative correlation (-0․352) for customer churns․ This means older customers are more likely to stay‚ while the new ones are more likely to churn․ MonthlyCharges was positively correlated (0․193)․ This confirmed the fact that customers with higher monthly charges were more likely to churn․ ServiceCount (number of addon services subscribed) somewhat improved churn․ SeniorCitizen and MonthlyCharges were strongest predictors of high risk‚ perhaps due to high charges and customer demographics․ From these analyzes‚ targeting new sign-ups in their first few months and providing them with high-value low-cost bundles are two potential retention strategies․
CORRELATION ANALYSIS

Results:
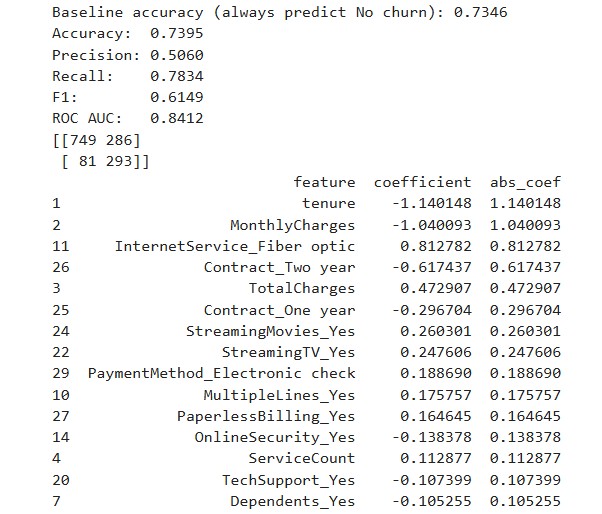
For predicting customer retention‚ using the classification model‚ we have a strong ROC AUC of 0․8412 and a strong Recall of 0․7834‚ which allows the business to catch nearly 80% of churners before they leave․ The model performs much better than the baseline model of 73․46% while still having good predictive power․ The model is high in sensitivity‚ but the precision is only 0․ 5060․ However‚ the estimate of the coefficients indicates that the higher the tenure and MonthlyCharges‚ the lower the likelihood of churn (-1․14‚ -1․04)․ On the other hand‚ the longterm loyalty contracts tend to strongly suppress the churn (Contract Two year -0․61)․ Seeing InternetServiceFiber optic and TotalCharges as the main positive churn drivers suggests there may be dissatisfaction with the premium price for internet service or the underlying infrastructure's quality․ However‚ this model could give the business an actionable plan to target high churn-risk accounts with timely‚ personalized loyalty offers or contracts designed to incentivize retention․
PowerBI Layer
This step happens in Power BI Desktop, using telco_churn_cleaned.csv as the source. Build four visuals, matching the structure referenced on the resume:
- Churn Likelihood: A matrix or bar chart showing the churn rate by Contract type and TenureBucket (the 42․71% / 11․27% / 2․83% true breakdown)
- Revenue at Risk -- A card visualization that shows $139‚130․85 of monthly revenue associated with churned accounts as a fraction of $456‚116․60 in total monthly revenue
- Contract Length‚ a stacked bar of number of customers at each Contract type by churn status
- Customer Segment ‚ an additional table/matrix built by combining the InternetService and TechSupport features since fiber-optic customers without tech support are the most at-risk group in this dataset
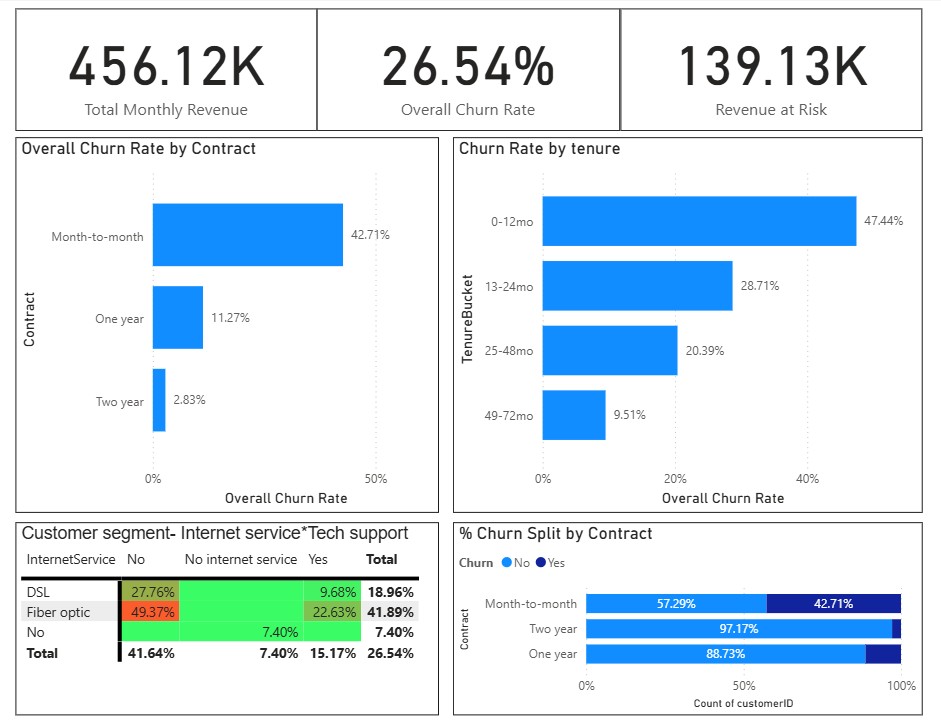
Results:
Expanding into the underlying volumes and structural cross-sections reveals how these risks manifest across the customer base. While month-to-month contracts exhibit the attrition rate, a look at the contract distribution shows they also constitute the overwhelming majority of churn volume leaving the company heavily exposed to transactional revenue volatility. This risk is quantified by the metrics, which reveal that 30.5% of the total monthly revenue baseline ($456,116.60) is tied directly to churned accounts ($139,130.85) signaling a disproportionately high-value exit pattern rather than just low-spending trial users. Furthermore cross-segmenting the service stack exposes a severe product-level friction point: fiber-optic subscribers who lack dedicated technical support drop to a baseline churn rate of nearly half their segment whereas adding tech support cuts that churn rate by more than half (down, to 22.63%). This indicates that the churn problem is not merely a pricing issue but an operational delivery failure where premium, bandwidth users are being left to troubleshoot infrastructure complexities without an adequate support safety net.
Key Findings
Churn rate: 26.54% (1,869 of 7,043 customers)
- Contract type is the single strongest churn driver: 42.71% (month-to-month) versus 2.83% (two-year)
- New customers are highest-risk: 47.44% churn in the first 12 months falling to 9.51% after 49 months
- Fiber optic customers churn at 41.89% versus 18.96% for DSL. Worth investigating pricing or service quality
- Customers without tech support churn at 41.64% versus 15.17% with it. Support access is a meaningful retention lever
- $139,130.85 in monthly recurring revenue currently sits with churned accounts
Business Recommendations
Retention is the focus. I suggest prioritizing retention outreach for customers in their first year. Contract type and tenure are two of the signals that a customer may churn. Both the raw data and the predictive model confirm this. This group sits at the intersection of those two signals.
Fiber-optic customers churn at 41.89% while DSL customers churn at 18.96%. That gap is large enough to raise questions about price or service quality. A targeted survey of fiber customers would help us decide which problem to fix first.
Bundling or upselling support to at-risk customers is a quick lever for retention. Customers without support churn at 41.64% while those with support churn at only 15.17%. That 26-point difference is one of the gaps in the data.
Finally when a new customer stays beyond the few months encouraging an upgrade to a one- or two-year contract could be a retention strategy. The exact timing is not set by this analysis; it should be treated as a hypothesis to A/B test, than a data-backed cutoff.
Limitations
This analysis identifies statistical associations, not proven causes. No A/B test or intervention was run against these findings so 'customers without tech support churn more' does not by itself prove that adding tech support would reduce churn for a given customer. The dataset is also a snapshot in time rather than a longitudinal view, so seasonal or cohort effects aren't captured. Any resulting retention strategy should be. Measured before being rolled out at scale.
Tools & Files
- telco_churn.csv. Raw dataset (7,043 rows)
- telco_churn.db. PostgreSQL database
- telco_churn_cleaned.csv. Cleaned dataset with engineered features (ChurnFlag,
TenureBucket, ServiceCount) ready, for Power BI import